For too many years aviation lacked a reliable, up-to-the-minute system for reporting runway surface conditions for pilots to make accurate landing performance assessments. Rather, we depended on subjective braking action reports or Mu-Meter readings that did not directly translate into an aircraft’s braking effectiveness.
It is no surprise that too many aircraft have skidded off slippery winter runways despite the best efforts of professional flight crews. Dynamic snowy weather afflicted the New York airports on March 5, 2015. By 0738, a NOTAM was issued indicating that LaGuardia’s (KLGA) Runway 13 was covered with thin, wet snow. By 0851, 1.8 in. had fallen, resulting in 0.25 in. of wet snow on the runways. An hour later, another 0.5 in. had fallen.
Delta Flight 1086, a Boeing MD-88, left Hartsfield-Jackson Atlanta International Airport (KATL) that morning for the flight to snowy LaGuardia. While en route the flight crew monitored the New York weather conditions and weighed the factors that could affect stopping performance. The crew asked the dispatcher and the Washington ARTCC controller for braking action reports, but neither had any at the time because KLGA operations personnel were conducting snow removal operations and no aircraft were landing. (With medium/fair braking condition reports, the calculated landing distance utilizing maximum autobrakes was 7,800 ft.; Runway 13 is 7,003 ft. long.)
After the runway reopened, four airplanes landed on Runway 13 ahead of the accident airliner. A United Airlines Airbus A319 landed 18 min., 53 sec. prior and reported medium braking action at the touchdown zone. Another United A319 landed 16 min., 16 sec. prior and reported good braking action, as did a Bombardier CRJ700 that landed 8 min., 23 sec. ahead of the accident aircraft. Delta Flight 1526, an MD-88, landed 2 min., 53 sec. ahead of the accident aircraft but did not report braking action, nor was it requested. If you were in line for the approach, these braking action reports would be encouraging, right?
On approach, the flight crew asked for the most current winds. It was reported as 020 deg. at 10 kt., producing a 4-kt. tailwind component (less than Delta’s 10-kt. limit) and the crosswind component was 9 kt., which was less than Delta’s guidelines for medium/poor runway conditions. The captain decided to continue the approach to a landing because he and the first officer had determined that the landing criteria had been met.
Besides company and ATIS reports, ATC communications as late as 1040 gave the impression to the flight crew that at least some patches of the runway surface would be visible upon breaking out of the IMC on the approach. However, upon first seeing the runway at 233 ft. AGL, the surface appeared white. This was contrary to the crew’s expectations given the recent snow cleaning operations and the reports of good braking.
The pilots knew that two preceding airplanes had reported good braking action. However, it would have been difficult for them to visually assess the nature and depth of the snow on the runway.
Also, little time was available to reevaluate the decision to continue. Only 13 sec. elapsed between the time the captain called the runway in sight and the 50-ft. automated callout.
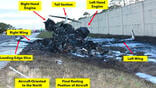
Due to the combination of slippery runway conditions, an adverse wind, an unequal spool-up of the thrust reversers that contributed to a yaw, and a momentary usage of excess reverse thrust that resulted in rudder blanking, the aircraft veered and departed the left side of the runway about 3,200 ft. from its threshold. It contacted an airport perimeter fence and came to rest with the airplane’s nose on an embankment next to Flushing Bay. The pilots, flight attendants and 98 passengers were uninjured, while 29 passengers received minor injuries. The airplane, however, was substantially damaged.
The NTSB determined that the probable cause of this accident was the captain’s inability to maintain directional control of the airplane due to his application of excessive reverse thrust, which degraded the effectiveness of the rudder in controlling the airplane’s heading. An in-depth reading of the extensive accident investigation report reveals that the flight crew otherwise met every professional expectation in this event, to include attempting to get information on the runway condition, comparing that inadequate information with the landing performance data, and flying an approach that was “spot on.”
This accident amply illustrated the continuing need for determining runway friction characteristics in operationally meaningful terms. The NTSB recommended the FAA “continue to work with industry to develop the technology to outfit transport-category airplanes with equipment and procedures to routinely calculate, record and convey the airplane braking ability required and/or available to slow or stop the airplane during the landing roll.”
Reported Braking
The aviation community has long relied on braking action reports despite their limitations and subjective nature. They may be influenced by the reporting pilot’s familiarity with contaminated runways, the aircraft or the use of deceleration devices. It is also easy for a pilot to mistake aerodynamic and reverse thrust deceleration forces for braking forces.
The second major flaw with the reports is the rapidity with which runway conditions can change depending on precipitation, temperature, usage and pavement treatment. Thus, a runway’s condition can be significantly different than that indicated in the most recent report. Weather conditions that should cause us to be wary about the braking effectiveness include precipitation during near-freezing temperatures or rapidly changing meteorological conditions.

Another situation that should cause doubt about braking conditions is when an airport reports compacted snow. This can occur even at the busiest airports equipped with a fleet of snowplows when the amount of incoming traffic denies them enough time to remove the white stuff down to “dry pavement,” and landing aircraft hammer the remaining snow into that hard-packed sheet. It can also occur at airports with inadequate snow removal services, which is a situation common to many smaller general aviation facilities.
As already noted, another major shortcoming with braking action reports is their subjectiveness. The pilots of two identical aircraft landing in the same conditions on the same runway could give different braking action reports. The disagreement could be the result of differences between the aircraft, weight, pilot technique, experience or expectations.
According to “An Evaluation of Winter Operational Runway Friction Measurement Equipment, Procedures and Research,” a report by the Winter Runway Friction Measurement and Reporting Working Group (comprising representatives from the FAA, NASA, Transport Canada, Airports Council International, American Association of Airport Executives, Regional Airline Association, Air Transport Association and Air Line Pilots Association), “Subjective braking action reports generated by pilots and drivers of airport vehicles, which are commonly relied on in the U.S., have no proven correlation to aircraft braking performance. Reliance on these subjective braking action reports may actually be a detriment to safety in some cases.”
An additional problem with braking reports is the variability among aircraft. When a braking action report is received from one type of aircraft, its relevance to another is a matter of conjecture. An aircraft with dual-track landing gear has a lot more tire contact area than one with a single-track gear. In general, it’s a matter of “rubber on the road” and the aircraft with more tire contact will have greater braking effectiveness. Differences in tire pressure and tire design will greatly influence stopping power as well.
And if the aircraft has an operable anti-skid system, it will make a substantial difference in the pilot’s evaluation of the braking action. Thrust reversers on a slick runway will decrease the stopping distance by 10-30%, and this varies by aircraft design. Turboprops with particularly flat pitch angles at flight idle or reverse are able to reduce their stopping distance somewhat more as the frontal area from those blades can be particularly effective on an icy runway as long as both props go into reverse evenly. Combined, all those factors bring into question whether an aircraft that landed ahead of us is really a good gauge of the braking conditions we will experience upon touching down.
A problem that is particularly inherent to business aviation is lack of runway surface condition reports when going into uncontrolled airports. An earlier review of 81 NASA Aviation Safety Reporting System (ASRS) reports of runway excursions by business jets by this author found that 94% of the flight crews did not have an adequate report of the runway surface condition when landing. Without a braking report you have zero idea of what to expect upon settling on the runway. It could be as dry as a desert runway, or as slick as a hockey rink after grooming by a Zamboni machine.
Using Hard Data
Some might wonder if it’s possible for measured braking data from a landing aircraft to be sent directly to those following. While technically doable, there are some important limitations with this approach. Pilots seldom use the wheel brakes sufficiently to get an accurate measurement of the conditions, particularly during the higher speed phase of landing when thrust reversers are more effective. Since wheel braking doesn’t become the primary means of deceleration until reaching lower speeds of the landing roll-out, it isn’t possible to get an accurate measurement of the friction over the entire length of the runway. Lastly, each landing involves a large amount of variability, particularly when a runway is partly contaminated.
Friction Measurement
The industry has attempted for years to accurately determine a runway’s friction using a variety of ground friction measurement devices (GFMDs), but different instruments do not always give consistent readings on the same surface. Large efforts were attempted but failed to improve the consistency between models and to correlate these accurately to airplane braking performance.
During braking, the rotational speed of an aircraft tire is less compared to a free-rolling tire. As the tire rolls and slides, friction is created by deformation within the snow/ice, and by the creation and destruction of interfaces at the contact points. High sliding speeds can induce frictional melting and loose material (water, slush, wet or dry snow) has to be squeezed out of the contact area before friction can be obtained.
Parameters like the travel speed, tire characteristics, tire inflation, aircraft weight applied to the tire (more properly in engineering terms, this would be the “normal load”), braking mode, contact time as well as the algorithms of an aircraft’s anti-skid system produce significantly different friction between GFMDs and aircraft tires with a runway surface.
Wet Snow and Slush
Higher precipitation intensities with wet snow are more likely to create “poor” or “less than poor” braking conditions, according to Norwegian engineers who analyzed the aircraft braking friction of Boeing 737 aircraft during five winter seasons. They found 21% of the landings on wet snow produced braking conditions that were poor or worse. This percentage is significantly higher than on dry snow (7%) or slush (11%).
Slush is recognized for its ability to create “impingement drag,” which results when dense contaminants (water, spray, ice particles, etc.) impact parts of the airframe, such as the flaps behind the main gear. Precipitation displacement drag is created when an aircraft tire pushes runway contaminants out of the way as it rolls down the runway. Wet snow, slush and standing water can cause structural damage from spray impingement or by engine ingestion, which can affect acceleration capability.
One might think that the impact on an aircraft tire from wet snow or slush would be identical, but it is not. Slush is a composition of water and ice particles. When a tire rolls on pavement covered by slush, the tire squeezes the water from under the contact area. This process generates pressure on the surface of the tire, preventing its contact with the pavement. This is hydroplaning. Full hydroplaning occurs when the tire slides over the film of water without reaching the pavement texture. The thickness of the water influences the degree of hydroplaning. When the thickness is limited, the tire will be in partial contact with the pavement texture and able to generate reasonably high amounts of braking action.
Wet snow, which consists of ice particles, water and considerable amounts of air, has a different effect on aircraft tires. Since it’s compressible, it compacts under the tire, filling the pavement’s texture, thus reducing a tire’s friction with the runway.
Temperature is an important element in this assessment, according to the FAA’s Advisory Circular 91-79, Runway Overrun Prevention (dated Nov. 6, 2007). Slowly freezing water or melting snow on the runway can become slush. As temperature decreases this mixture can become ice. Each of these conditions affects the stopping performance differently. The properties of a contaminant on a runway can change over the course of a day due to solar radiant heating, ambient temperature changes or chemical treatment. The runway that was adequate for takeoff in the morning may not be for landing in the afternoon simply because the temperature rose, and the compacted snow started to melt and turned to wet snow and slush.
Boeing does not recommend takeoffs when slush, wet snow or standing water depth is more than 0.5 in. or dry snow depth is more than 4 in. However, it is challenging, if not impossible, for a flight crew to know what exact contamination exists on the runway at any point in time. Yet it is critical that they obtain accurate reports on the runway contaminant. The challenge for them is to translate the sometimes-complex information on runway surface condition into a single classification on the runway condition landing performance level. A better solution to that problem has finally arrived.
RCAM
The Southwest Airlines landing overrun accident involving a Boeing 737-700 at Chicago Midway Airport (KMDW) in December 2005 initiated an FAA audit to evaluate the adequacy of current regulations and guidance information. The internal review revealed a multitude of systemic problems. Approximately 50% of FAR Part 121 turbojet operators’ manuals did not have policies for assessing whether sufficient landing distance exists at the time of arrival. Not all operators who perform landing distance assessments account for runway surface conditions or reduced braking action reports. Many operators did not include safety margins in their landing data. Data from third-party vendors indicated shorter landing distances than the manufacturers’ data. Incorrect data for thrust reversers were discovered. Wet and contaminated runway landing distance data did not represent actual performance and landing distance information was not provided in a standardized manner.
These discoveries led to the formal charter of the Takeoff and Landing Performance Assessment Aviation Rulemaking Committee (TALPA ARC), a noteworthy effort composed of representatives from airplane manufacturers, major airlines, trade groups, pilot unions, airports and regulatory authorities. The group stipulated the need for standardized methods for assessing runway conditions and disseminating those through airport operators, the NOTAM system and ATC. Furthermore, there had to be a method for integrating braking action reports by pilots and providing a direct correlation with airplane performance data. The product of these efforts was the creation of the Runway Condition Assessment Matrix (RCAM).
During the winter of 2009-10, the matrix was validated at 10 snow-prone airports in Michigan, Minnesota and Alaska. During the following winter, the matrix was further validated at 29 airports that included well-known snow-challenged airports in New York, Rocky Mountain ski destinations and Alaska.
The matrix divides a runway into touchdown, midpoint and rollout sections and provides pilots with touchdown-zone-specific information along with the percentage of coverage. The system will no longer report “Mu” friction values and vehicle braking will no longer be reported for runway
conditions.
The “Runway Condition Description” section of the RCAM includes contaminant type and depth categories that have been determined by airplane manufacturers to cause specific changes in airplane braking performance. The use of Runway Condition Codes harmonizes with ICAO Annex 14, Aerodrome Design and Operations, providing a standardized “shorthand” format for reporting condition (and replaces Mu values). Those codes are not generated for taxiways, ramps or helipads and are generated only when the total runway surface (or the cleared width) is contaminated by more than 25%. These provide the type and depth of contaminants, estimated aircraft braking that can be anticipated, and targeted performance data. The Runway Condition Codes are communicated via the NOTAM system, Flight Service Stations, ATC facilities (tower, center, TRACON, etc.) or directly from airport operators via CTAF.
A previous shortcoming in landing data was they did not integrate well with the information communicated to flight crews. Now, airline operating manuals have been modified to provide landing data that correspond to the Runway Condition Codes. Landing distances also are adjusted for tailwind, no-reversers and using autoland, critical steps that should be considered during the Landing Performance Assessment.
If landing distance data based on the Runway Condition Code/braking action are not available in your aircraft flight manual (AFM), the industry has established “Landing Distance Factors” that may be used with your AFM’s dry runway (unfactored) landing distance to determine the Landing Distance Required. These factors incorporate a 15% safety margin.
The “Downgrade Assessment Criteria” column provides guidance if the airport authorities believe that the conditions are slipperier than the Runway Condition Codes might indicate. This gives reporting authorities the ability to take downgrade actions. The correlations of the Mu values with runway conditions and condition codes in the RCAM are only approximate ranges. The “Vehicle Deceleration or Directional Control Observation” column is used to correlate estimated vehicle braking experienced on a given contaminant. The “Pilot Reported Braking Action” column provides other pilots with a degree of expected braking.
Applying the Information
The RCAM is an immense improvement over previous systems, but like any tool, its effectiveness depends on skillful application by its users. Recommendations from industry working groups and the manufacturers highlight key factors that are especially important when landing on runways with compromised conditions.
A flight crew’s landing performance assessment is based on the information available on the runway’s condition. It is the sole responsibility of the pilot performing the inflight assessment to determine whether the transmitted information can be considered reliable.
The estimated runway condition and predicted landing performance may be sensitive to temperature and falling precipitation. This is especially the case when the temperature can change the water contaminant from liquid to solid (water to ice) or vice versa. For instance, the landing performance is poor on dry ice, but can become impossible if the ice surface is melting.
When snow, ice or slush accumulates, it is necessary to clean the runway as well as perform a runway condition assessment. After the stuff is removed, the runway is inspected before it reopens for air traffic. Both actions require time, and falling precipitation can make it difficult to perform an accurate measurement. The time difference between runway inspection and when operations renew is called the report age and expresses how long snow had accumulated before the landing took place.
The assumptions used for dispatch planning will most probably no longer apply to the actual conditions at the time of landing when dynamic weather prevails. The calculated landing performance depends on no unexpected variations from reported conditions. Pilots should understand that landing distance charts only consider a single contaminant evenly distributed on the runway.
A savvy flight crew needs to anticipate all the realistic degradation or aggravating factors and determine the thresholds below which a safe landing can still be performed. It may be necessary to re-evaluate landing performance prior to committing to landing.
The management of a final approach includes being on speed in the proper configuration. The aircraft should be firmly flown onto the runway at the aiming point. A firm touchdown prevents sluggish wheel spin-up and/or delayed flight to ground mode transition of the squat switches. The landing performance numbers assume touching down in the touchdown zone on speed, and timely activation of deceleration devices. There is no margin left if the flight crew makes a slightly long flare or there is a slight lag applying deceleration means.
Do not delay lowering the nosewheel onto the runway. It increases weight on wheels. Further, there should be no delay in ground spoiler extension, brake physical onset and reverse extension. Decelerate as much as you can as soon as you can.
Reverse thrust is most effective at high speed. Let the anti-skid do its work. Do not pump the brake pedals. Do not use asymmetric reverse thrust on an icy or slippery runway unless necessary to arrest a skid. When using reverse thrust, be prepared for a possible downwind drift on a slippery runway with a crosswind. It is even more important than usual to resist turning off the runway before the airplane has slowed to taxi speed.
The RCAM provides pilots with meaningful reports on runway surface conditions so they can make accurate landing performance assessments. Landing performance charts have been modified to integrate well with the reported Runway Condition Codes. But even with these much needed improvements, the fact remains that the safety margins on wintry runways remain thin, and every landing needs the flight crew’s utmost attention and error-free performance.

Related Content