How To Use The 2025 Operations Planning Guide

This year’s Operations Planning Guide covers turbine-powered, in-production aircraft. The aircraft operating costs presented are in a format that separates information into six areas: Direct Mission Costs, Fixed Annual Costs, Variable Costs, Annual Cockpit Subscription Services Costs, Annual Cabin Subscription Services Costs and Annual Trip Support Costs. The Operations Planning Guide also includes information from business aviation industry experts covering flight department compensation and planning, hiring and salary analysis; legal aspects related to aircraft acquisition and tax planning considerations; and insurance factors affecting coverage expenses to plan for.
- Aircraft Category:
Aircraft are grouped into six categories reflecting similarity of aircraft size, mission and operations. Category 1 aircraft are turboprops weighing less than 12,500 lb. and very light jets weighing less than 10,000 lb.; Category 2, multiengine turboprops weighing 12,500 lb. or more and light jets weighing 10,000-19,999 lb.; Category 3, jets weighing 20,000-29,999 lb.; Category 4, jets weighing 30,000-40,999 lb.; Category 5, jets weighing 41,000 lb. and up; and Category 6, ultra-long-range jets with NBAA instrument flight rules (IFR) ranges above 6,000 nm.
Certain data are common to all aircraft in a category for purposes of calculating mission cost by listed range, including airframe systems parts and labor, engine reserves, auxiliary power unit (APU) reserves and propeller reserves for turboprop aircraft. Fixed costs, annual cockpit subscription services costs, annual cabin services costs and annual trip support cost figures are provided for reference only and are not included in the Direct Operating Cost (DOC) figure for each of the Mission Ranges (300 nm, 600 nm, 1,000 nm, 3,000 nm and 6,000 nm).
- BCA Equipped Price:
This number is taken from the Q1 2025 BCA Purchase Planning Handbook, and reflects BCA-equipped, completed aircraft. The listed price is based on the latest model produced.
Direct Mission Costs
Three mission ranges are shown for each aircraft (Categories 1–5): 300 nm, 600 nm and 1,000 nm. Ultra-long-range aircraft (Category 6) missions are 1,000 nm, 3,000 nm and 6,000 nm. The fuel expense for each mission is based on the fuel consumption figure for the mission provided by the OEM and calculated under conditions shown in the Operations Planning Guide.
Missions are calculated utilizing the manufacturer’s recommended cruise setting. Therefore, cruise settings may vary from aircraft to aircraft, i.e. max cruise versus long range. Where the aircraft cannot cover the mission distance with an 800-lb. (four-passenger) payload, BCA shows a reduction in payload or a reduction in mission length at the editor’s option.
Direct Mission Costs include a bundling of mission fuel consumed, maintenance labor, parts and reserve costs from the Variable Costs section of this guide, apportioned to the actual flight time for the listed nautical mile mission length. Fuel price used is based on a nationwide average price of $5.69 per gallon for Jet-A at press time.
Fuel consumption calculations account for taxi, takeoff, climb, cruise, descent and landing for the applicable mission as appropriate for the aircraft category. Please note that longer missions will lower average hourly fuel burns due to more time in cruise. Conversely, shorter missions will increase average hourly fuel burn figures, since proportionally more time is spent in the takeoff and climb phase rather than cruise.
- Fixed Costs (Annual):
This area of expense includes those costs that must be borne by the flight department irrespective of the level of aircraft utilization. So far this year we are seeing fluctuating economic news and lower inflation as demand and supply shifts toward hiring qualified flight crew in the corporate segments. Most corporate operators are facing tough competition for qualified crews.
Salaries: Included are salaries for Flight Crew, Cabin Crew and Director of Maintenance where appropriate.
When asked about the state of corporate operators, Sheryl Barden, Aviation Personnel International’s CEO, says: “We have seen some flight departments going away for a variety of reasons. Activist investors are having an impact,” and some operators are shifting to charter or fractionals. “We are in the eye of the storm and what comes after it is not well understood,” she says. “Compensation adjustments remain critical to retain or attract new flight crews.”
Even though “airlines are not hiring at the pace they were last year, that may be temporary. The backlog of getting new aircraft is slowing hiring. More resumes are being submitted for job openings than a year ago.”
Barden elaborates, “Exacerbating the compensation challenges are discerning aircraft owners who want experienced crews at all levels, and they are willing to pay top dollar for the talent they want.”
While she says maintenance salaries have been stagnating recently, they are “again on the rise, but not as aggressively.” Contributing factors include not enough people getting airframe and powerplant (A&P) licenses and going into maintenance, as well as attrition due to retirements.
Regarding cabin crew salaries, they are also “leveling off, but to attract and retain cabin crew, the name of the game is still retention,” Barden says.
Compensation Analysis
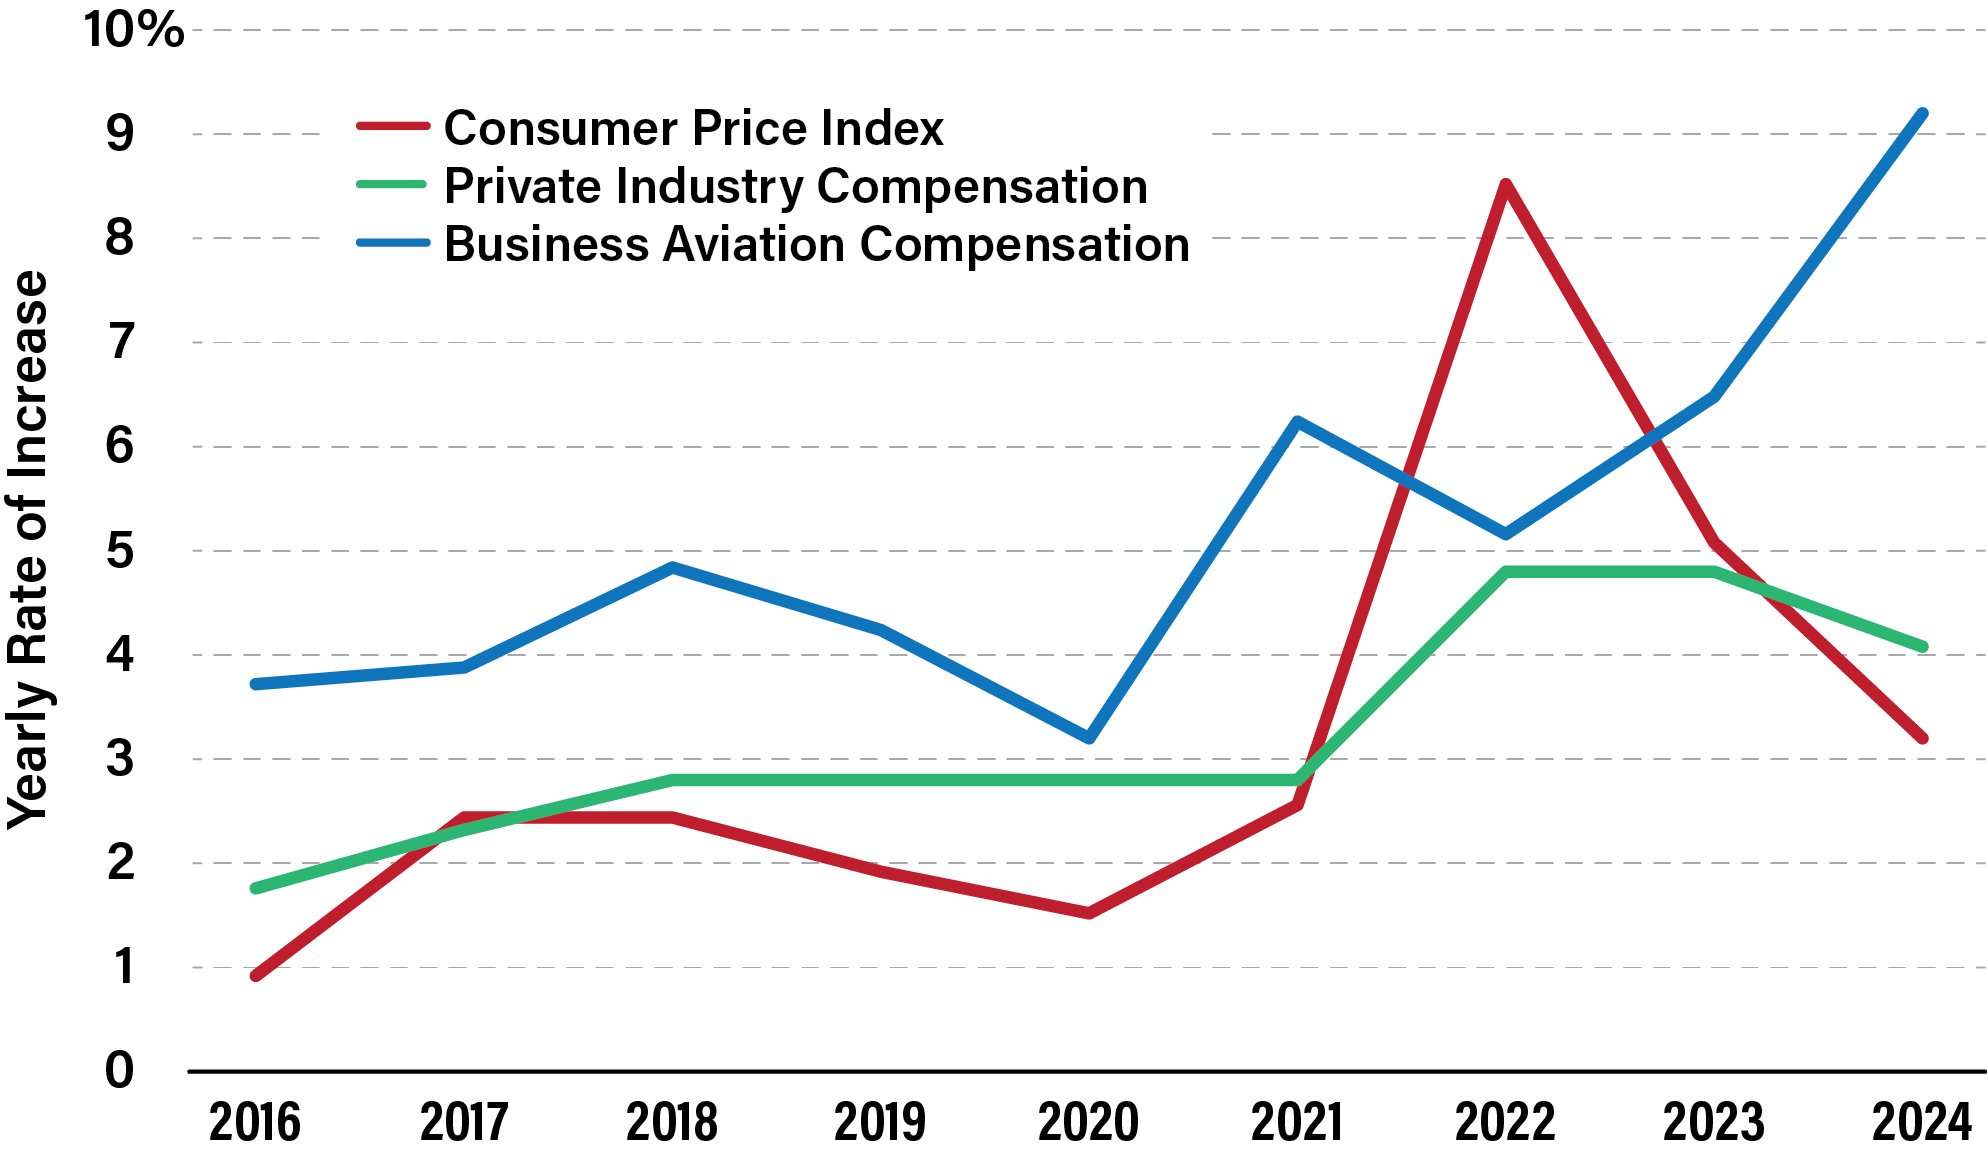
AirComp Calculator’s latest salary survey, comparing 2024 data to 2023, shows business aviation compensation increased an average of 9.7% across the 14 jobs that it tracks.
“Pilot compensation increased over 10%, indicating that pilot demand remains high and aviation managers and high-net-worth individuals are willing to pay more to attract and retain talent. Interestingly, of the various pilot job titles—chief pilot, senior captain, captain and first officer—it was the latter that saw the largest growth in compensation, nearly 16%. This may be indicative of a trend where aviation organizations are trying to spend their compensation budgets growing and retaining more junior personnel in their organizations,” says Christopher Broyhill, CEO of AirComp Calculator and a certified aviation manager.
Broyhill elaborates: “There are many who are eager to declare the pilot shortage over, but that outlook is shortsighted. None of the conditions that generated the shortage have been remedied. Instead, there is a temporary ebb in airline hiring due to aircraft delivery delays and some economic uncertainty.”
He cautions against paying lower pilot salaries due to the decreased demand now because when airlines start hiring more again, “there will be a rude awakening sooner than they realize,” Broyhill says.
“Speaking of shortages, the shortage in maintenance professionals continues to be manifested, but sadly, wage pressure does not always accompany it,” he adds. However, maintenance supervisors’ compensation grew 15% year-over-year.
“The current labor market for business aviation personnel, particularly pilots, remains very dynamic. Every major airline has agreed to new contracts from their respective pilots’ unions with compensation increases between 34% and 50%,” Broyhill says. “NetJets’ pilot union just landed a contract with a 52.5% increase. These factors will generate consistent wage pressure in the pilot market for years to come.”
Another factor driving up compensation is “the willingness of high-net-worth individuals to pay high wages to poach pilots and technicians from corporate operators. Personnel who are trained and have experience with the newer, ultra-long-range equipment [Gulfstream G650, G600, G700 and Global 7000/7500] have become commoditized. It is not uncommon for pilots in these aircraft to make figures in the mid-$300,000s,” he says.
Broyhill concludes: “While paying at the 50th percentile or using a lead-lag modality centered on the 50th percentile used to be an accepted strategy, business aviation operators are now regularly targeting the 75th percentile to ensure they stay ahead of the market. Make no mistake, in today’s compensation market, an operator is accepting risk if they target the 50th percentile, because someone, either the airlines or a competitor, will pay more.”
Flight Crew Training: Crew training constraints are anecdotally improving due to better planning and scheduling. However, the available qualified employees remain very tight as pilot training slots can now extend out two years. This is putting extreme pressure on flight departments to find already qualified crewmembers. The training expenses shown are based on average transaction costs for representative aircraft models. Actual expenses can vary due to market capacity fluctuations, changes in training locations and other factors such as training volume and length of commitment.
Cabin Crew Training: These expenses are provided as budgetary planning numbers only.
Maintenance Training: This estimated cost is per technician and includes initial maintenance training on an aircraft model. Data reflected here was initially compiled by ARGUS and escalated to accommodate inflation.
Hull And Liability Insurance: Aircraft hull and liability (and all aviation insurance in general) premiums have remained dynamic since last year’s Operations Planning Guide, particularly for single-pilot, owner-flown, high-asset-value aircraft.
Tom Hauge, Wing Aviation Insurance’s national sales director, says: “The business aircraft hull and liability insurance market continues to soften as we approach [the second quarter of] 2025—this after a six-year or so period that saw reduced capacity and hardening rates. The emergence of insurers Eiger, Beacon, Mach 2 and soon-to-start Class A and 5X5 has had a much-needed impact on the pre-2025 capacity challenges.”
Hauge sees a bit of a split in the market. “Insurers remain focused more intensely on risk selection, with the most favorable risks seeing strong premium reductions and broadened competitive options in the underwriting market. Corporate operators with strong safety records, robust training programs and proactive maintenance practices are seeing more favorable terms, while those with claims histories or older fleets face stricter underwriting scrutiny and higher costs.”
However, with new insurance companies entering the market, the greater capacity “potentially brings additional options in the space even for less-than-desirable risks. High-value business jets, particularly large cabins and ultra-long-range models, often carry substantial hull values that drive premiums higher. With the higher insured values [more than $25 million hulls] and limit requirements over $300 million—the space remains unchanged from prior years with mostly the seven to eight legacy insurers,” Hauge says.
Looking forward, insurers are starting to leverage technology, including: “advanced data analytics, predictive modeling and even telematics to better understand and price risk. At the same time, operators are under pressure to demonstrate best practices not just in flying, but across their entire operation—from cybersecurity to regulatory compliance,” he adds.
Given this, “strong risk management and a proactive approach to working with insurers are more important than ever” for corporate operators, he says.
Hull Insurance Per $100: This is the factor used as a multiplier to arrive at the total annual cost of hull insurance for a particular aircraft. It is derived from actual aviation insurers’ quotes. Insurance quotes can vary depending upon whether the aircraft is covered under a fleet policy or a standalone policy. The first number reported is the estimated annual cost of hull insurance for a particular aircraft based on its BCA-equipped price as reported in BCA’s 2025 Purchase Planning Handbook. The cost is calculated by multiplying the cost per $100 of hull insurance factor by the BCA-equipped aircraft price. The figure includes war risk coverage, which constitutes on average $0.03 to $0.05 per $100 of hull insurance.
Liability Insurance: This figure represents the total annual cost for liability insurance for an aircraft model. Aircraft in Categories 1 and 2 are assumed to carry $5 million in liability insurance; Category 3 aircraft carry $100 million; and Categories 4 through 6 carry $200 million to $500 million in liability insurance coverage depending on make and model. The annual cost is calculated by multiplying the amount of liability coverage in millions by a per-million-dollar factor supplied by a leading provider of this type of insurance coverage.
Maintenance Software: The figure shown for maintenance software programs represents the average annual cost for a software program to track maintenance activities, intervals and expenses. This number should be utilized as a budgetary planning estimate.
Hangar/Office Facilities: Expenses shown here are based on the national average annual costs reported by flight departments and escalated for 2025 based on the annual rate of expected inflation. The figures shown in each cost area are broken down by the six aircraft categories and will be the same for all aircraft included in the same category. This figure is an annual cost per aircraft and includes hangar and office rental, as well as additional facilities costs such as utilities, ground upkeep, snow removal, janitorial service and insurance (other than aircraft insurance).
For more than one aircraft, it is valid to multiply the figure by the number of aircraft to arrive at a total flight department cost. Actual rental costs will vary widely from one geographical area to another.
- Variable Costs (Per Flight Hour):
These expenses are related to the operation of the aircraft and are represented as an hourly cost figure. Included are Maintenance Labor Expense, Parts Expense, Engine, APU, Avionics and Propeller reserve expenses as appropriate. For in-production aircraft, it is assumed the aircraft is covered by the manufacturer’s warranty. The figures shown are based on aircraft OEM direct estimates with warranty effect incorporated unless otherwise noted by an asterisk (*). For OEMs that did not participate this year, an inflation escalation was added to the most current available data.
Service center maintenance labor expense is computed by multiplying the Maintenance Man-Hours per Flight Hour ratio by the nationwide average service center hourly maintenance labor cost (Category 1: $142/hr.; Category 2: $142/hr.; Category 3: $148/hr.; Category 4: $154/hr.; Category 5: $166/hr.; Category 6: $166/hr.; Category 6: BBJ/ACJ MRO: $118/hr.) Labor expenses for each category noted here were used in the preparation of in-production aircraft maintenance labor costs per flight hour.
Airframe Systems Parts And Labor
This figure is a model-specific hourly expense with warranty considered. It should be noted warranty periods and coverage vary among OEMs and are not specifically defined in this description. Contact the OEM for policies related to new aircraft warranty and preowned aircraft within the warranty period for transfers related to the airframe, engines, APUs and avionics. The following descriptions define how maintenance man hours and parts expense were calculated into mission costs:
Maintenance Labor Hours/Flight Hour (in-production aircraft): An aircraft manufacturer-supplied ratio of maintenance man hours per flight hour. The number reflects an average for the first five years of operation while under warranty including scheduled maintenance and unscheduled maintenance events. Maintenance man hours per flight hour are multiplied by corresponding labor rate and by aircraft category, and incorporated into the Airframe Systems Parts and Labor variable cost figure line item.
Parts Expense (in-production aircraft): This hourly expense is derived from model-specific manufacturer’s quotes and includes parts expense for airframe systems. In-production aircraft parts expenses provided by the OEM have warranty taken into consideration. It should be noted that some warranty periods covered timeframes of less than five years as mentioned in the Remarks section of the operating cost tables. Airframe systems parts calculations assume unscheduled maintenance events would be covered by warranty and do not include reserves for engine or APU overhauls, hot sections, long-range maintenance events or propeller reserves. Those items are listed separately in the variable cost section. Avionics repair costs during the warranty period would also be covered by the OEM warranty, and therefore no reserve costs are shown for Categories 1–6 platforms. Regulatory mandates should be separately budgeted for when evaluating operating costs for each aircraft.
Engine Reserves And APU Reserves (where applicable): These expenses are based on OEM input for in-production aircraft where provided. Engine and APU OEMs and third-party service providers offer programs designed to fix or cover operator’s scheduled and unscheduled maintenance requirements on a per-hour, fee-paid basis. Engine and/or APU loaners may not be covered by these programs for unscheduled events resulting in significant out-of-service time for the aircraft. Consult policy terms and conditions or the service provider for specifics.
Avionics Reserves: For in-production aircraft, avionics reserves for Categories 1–6 are assumed not to be applicable due to OEM warranty coverage during the first five years of operation following entry into service. Additionally, upgrades to cover regulatory mandates are not factored in hourly operating costs.
Propeller Reserves (where applicable): These expenses are based on OEM input for in-production turboprop aircraft.
- Annual Cockpit Subscription Costs:
These are expenses related to cockpit navigation equipment database updates, safety services associated with flight planning and other services associated with flight operations. These services are typically purchased through the OEM in the case of FMS and GPS navigators or ground proximity system databases, and service providers for flight planning, charts and graphs and digital weather-related products. Information in this section is dependent on cockpit avionics configuration and pricing offered at the time of aircraft delivery, or as contracted with a cockpit services provider. Procurement of subscription services from a provider that offers training support on use of products as well as troubleshooting, system configurations on-wing and satellite communication link setup for service delivery where needed are highly desirable support elements. Typical subscription costs, which vary depending on mission needs, are reflected in this section. However, annual aircraft utilization and bundling of other services may reduce these expenses.
Navigation And EGPWS/TAWS Databases: Annual subscription prices are derived from OEM data sources or estimated where OEMs do not publish publicly available pricing and therefore should be viewed as directionally correct for budgetary planning purposes. Navigation database prices do not include optional bundled or enhanced feature pricing unless specifically noted. For example, navigation databases, plus terrain, traffic and other charts and maps, can be covered in a one-time renewal or annual subscription price depending on the avionics manufacturer. The aircraft or database supplier should be consulted about price quotes. Expenses shown vary depending on cockpit avionics equipment configurations and are approximate averages for in-production aircraft.
- Annual Cabin Services Costs:
Cabin services costs assume the aircraft is optioned with appropriate equipment at time of delivery from the factory. Aircraft Budget Analyzer provided budgetary planning numbers for Swift Broadband (SBB), KA/KU, SatTV and Cabin Iridium services. Estimated air-to-ground service costs are derived from published pricing where available. Cabin services, except for air-to-ground and cabin/iridium phone, are applicable to aircraft in Categories 4–6 due to suitable empennage and or vertical stabilizer antenna/radome solutions and suitable space for installation. Cabin services are for activation, on-wing field labor support, aircraft crew training expense or ongoing technical support associated with troubleshooting complex satellite communications equipment, and networks are not included. Many service providers offer a continuum of support services and should be contacted directly for information related to ongoing support and service activation.
- Annual Trip Support Costs:
Annual trip support expenses are similar for all aircraft in a particular category, reflecting comparable aircraft capabilities and mission utilization. Trip expenses include catering service, flight crew travel, international trip support, concierge, ground handling and landing/parking fees. Fees reflected are annual numbers assigned to specific aircraft categories. For aircraft in Categories 5–6, 400 annual flight hour utilization rates were used to arrive at budgetary planning estimates. For Categories 1–4, 250 annual flight hour utilization rates were used. Mission durations vary, which resulted in a change in the way these costs were calculated for the 2025 Operations Planning Guide. Many operators elect to use a service provider in the case of concierge and international trip support due to complexities associated with overflight and landing permitting and other logistical arrangement. International trip support and concierge were not factored in for aircraft in Categories 1–4 unless otherwise noted, or the aircraft had sufficient NBAA IFR range to justify a budgetary planning estimate.
- Strategic Aircraft Acquisition Legal Insights For Effective Operations Planning:
Selecting the right aircraft, whether for a first-time purchase or an upgrade to a new platform—can be a complex and demanding process. Successful acquisition begins with a clear understanding of operational requirements and business objectives to ensure the aircraft aligns with its mission profile.
As part of this year’s Operations Planning Guide, Michelle Wade, managing partner at Jetstream Aviation Law, provides a legal perspective on navigating the acquisition landscape.
Start With A Strategic Plan
Wade underscores “the importance of assembling an experienced team of aviation professionals early in the process.”
“A comprehensive acquisition plan should account for mission requirements, usage expectations, business goals, tax strategy and regulatory compliance,” Wade explains. “Equally important is allowing sufficient time to explore questions and conduct necessary research.”
For those considering financing, Wade advises that people not underestimate the lead time involved. “Selecting a lender, completing due diligence, securing loan approval and negotiating key terms can be time-consuming and must be factored into your timeline,” she says.
Legal Complexities:
Beyond the transaction itself, buyers must think ahead to post-closing ownership and operation. “Each buyer has unique tax and business objectives. There is no universal tax strategy that applies to every aircraft acquisition. Defining both federal and state tax plans is critical, and missteps in this area can be costly,” she says.
Wade notes: “Buyers should also be prepared to adapt to shifting regulatory and legal environments. FAA regulations, tax laws and international trade policies—including tariffs—can all impact the ownership structure and long-term operating costs of an aircraft.”
Special Considerations For Preowned Aircraft:
“Acquiring a preowned aircraft introduces additional layers of complexity. In addition to the core planning elements above, buyers must conduct thorough due diligence on the aircraft’s maintenance history, compliance status and ownership records. The timing and scope of the pre-purchase inspection, along with delivery conditions, must also be carefully negotiated,” Wade adds.
Wade advises: “For international transactions, the acquisition team may need to expand. If the aircraft is registered outside the U.S., you will likely need foreign aviation and tax counsel, as well as a U.S. customs broker.”
General: Abbreviations and annotations are used throughout the tables: “NA” means not available or not applicable to a particular aircraft model. An asterisk in brackets (*) in the model column indicates data was not available from the OEM or other sources and operating costs were estimated. Single pilot (SP) certified aircraft may not include a salary for the captain or co-pilot in the Guide Tables, and assumes the aircraft is owner-flown unless otherwise noted due to insurance requirements or typical mission usage; “NP” signifies that the specific performance is not possible; “OC” means on condition; and “INCL” indicates a particular cost item is combined with another specifically noted item.
Cirrus Aircraft offers an all-inclusive operating cost per flight hour product which includes recurrent training, all scheduled and unscheduled maintenance, all subscriptions and more. Variable costs are broken out only for the purpose of calculating direct mission costs for each of the predefined ranges.
Paul Lafata is the founder and CEO of AirPower Software Group. The company’s Aircraft Budget Analyzer is used by flight departments to access aircraft costs and budget planning.
Related Content