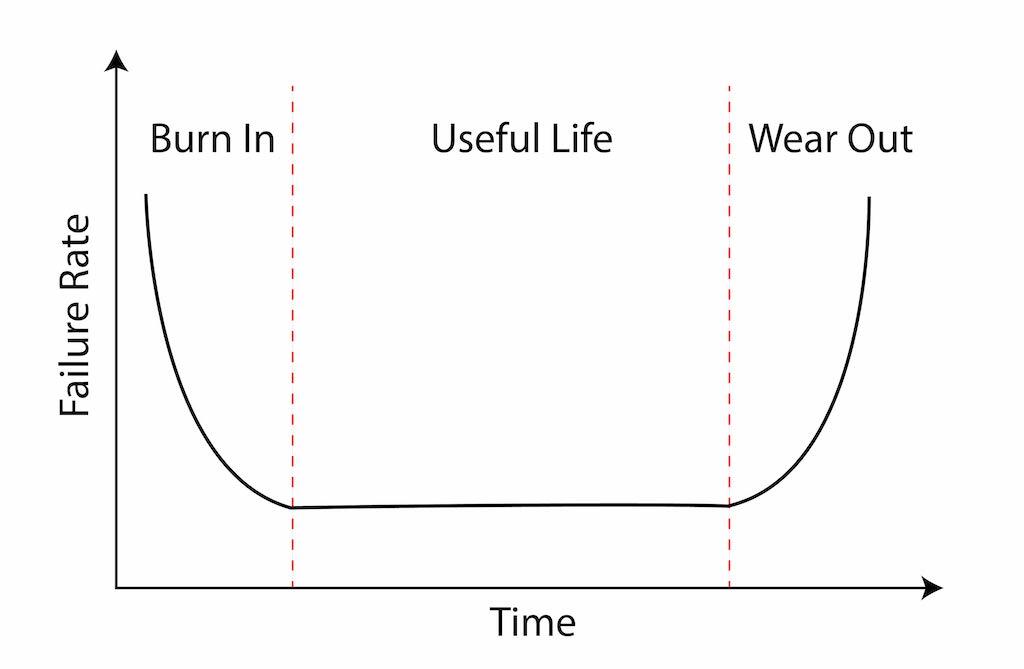
The reliability 'bathtub' curve.
You don’t have to be an engineer to understand what reliability engineers call the “bathtub curve.” The failure rate of a mechanical system starts high because the designers, builders and everyone else involved are learning the system and making corrections as they go. As the design and build process and operational procedures improve, the failure rate drops during the system’s useful life. Finally, the failure rate goes up as the system itself wears out. This makes instinctual sense, and we tend to see this with airplanes too. I’ve certainly seen it during my first decades of flying.
There is an adage in military aviation that says: “Never fly the A-model of anything.” In a 20 -year Air Force career, I flew three A models, including the wonderful Northrop T-38A Talon. The loss rate on that aircraft was just over seven per year during its first two decades of operational service. Then it dropped every decade since.
There is another truism I learned while serving as an aircraft budget officer at the Pentagon: “Never fly an aircraft once the maintenance budget per aircraft has been cut in half.” The Air Force tracks aircraft reliability with a statistic called “Mission Capable,” or the “MC Rate.” During my first year at the Pentagon, the officers in charge of the Lockheed C-141 Starlifter were alarmed by the third consecutive year of budget cuts in the cargo aircraft’s maintenance budget. Their MC Rate fell each year in that period and tarnished the aircraft’s once stellar record. Our handling of the aircraft ran contrary to another truism: “Unless you reduce the number of aircraft, the maintenance budget should go up with age, not down.”
The first production C-141 rolled out of the Lockheed factory in 1963 and the last in 1968. A total of 276 were built. In 1994, I was called by the Vice Chief of Staff of the Air Force (VCSAF) to explain the aircraft’s fall from MC grace. I explained that the chief culprit was the mechanical attitude indicator which tended to fail every 20 hours and that we could end that by installing a glass cockpit which would pay for itself in only two years. The VCSAF didn’t like the idea of spending millions on an airplane we planned to retire so the plan was disapproved.
The C-141 limped along for years until the last one was retired in 2006, giving the aircraft nearly 40 years of service, almost perfectly following the reliability rate predicted by the bathtub chart. But reliability rates on modern aircraft don’t seem to follow the same path. We’ve replaced our bathtub with a worn sawtooth.
The Worn Sawtooth
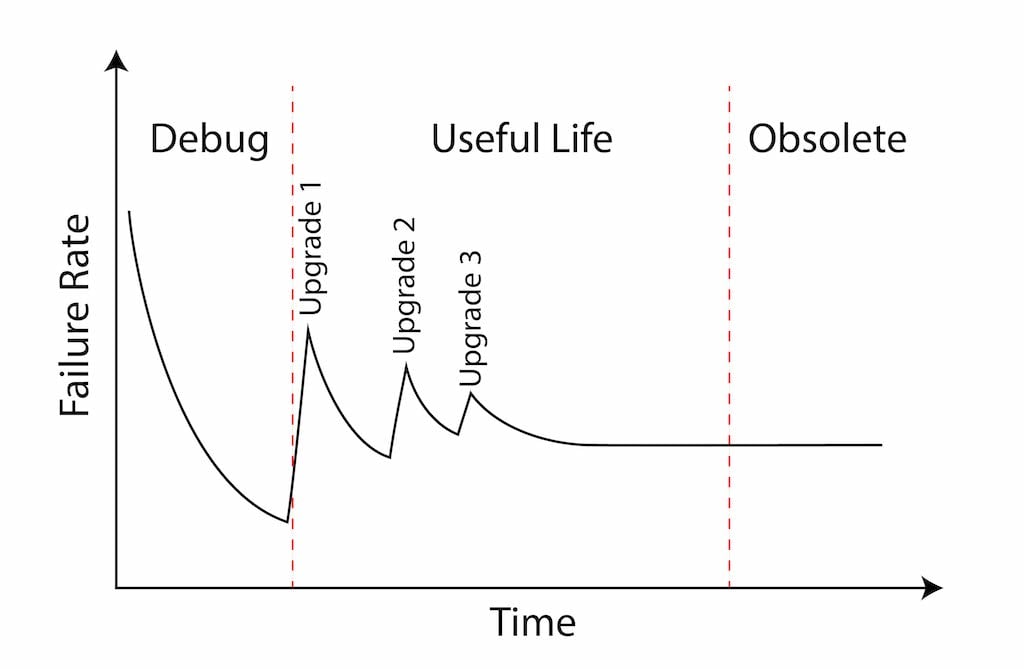
Our modern aircraft are impacted by computerization in more ways than just the obvious. Yes, many of the systems are computerized. But so is the initial design and ongoing maintenance tracking. We’ve extended the higher early failure rate period because it takes longer to learn where design theory falls short of operational reality. What we used to call the “shakedown” has become “test and debug.”
In 2008, for example, a Qantas Airbus A330 flying from Singapore-Changi International Airport (WSSS) to Perth Airport, Australia (YPPH) pitched nose down violently several times and could have been lost had it not been for the pilot’s quick reactions, systems knowledge, and calm under pressure. A design flaw in the aircraft’s three Air Data Inertial Reference Units (ADIRU) allowed what is called a “data spike” in a single Angle of Attack (AOA) probe to generate a pitch-down command under very specific and rare circumstances. The flaw, of course, has since been fixed.
This process of discovery and repair is nothing new, but it seems to happen more often in computerized aircraft. Finding a flaw in millions of lines of software code isn’t easy and the fixes themselves need to be tested. Manufacturers tend to release changes in groups and pilots are often told, “that’s coming in Block Three,” for example. Each new release generates a new cycle of reliability problems, which are hoped to be better than those before. The result is the decreasing spikes of the so-called worn sawtooth curve.
Just as software has extended the left side of the bathtub curve reliability, computerized design, maintenance and other tracking software virtually eliminates the right side of that bathtub curve. Many of our failure-prone components, like the C-141’s attitude indicator, are now practically failure free computers and displays that should outlast the airframe. We can now predict component failures by reports generated by the components themselves.
With few exceptions, we know what to replace or repair before failure. It is the exceptions that we need to worry about.
Software cannot be fully tested except in actual operational practice. We discuss in Part 3 of this article.
Aircraft Reliability: Theory Versus Reality, Part 1, https://aviationweek.com/business-aviation/safety-ops-regulation/aircra…

Related Content